
Forget Taxes, Let's Talk About Football
Are NFL In-Game Win Probabilities Accurate?
I promise this is still a newsletter about state and local tax policy. Please don’t click “unsubscribe” just yet! I even promise I’ll work in a tax connection before we’re through.
But let’s be honest: it’s almost Christmas. I don’t want to write about tax policy and you don’t want to read about it. Today I’m taking a detour to answer a question I’ve often wondered about while watching football: just how accurate are those in-game win probabilities, anyway?
Throughout most of the fourth quarter of Thursday night’s Rams-Seahawks thriller, ESPN and others gave the Rams overwhelming odds, peaking at 98.8% for ESPN. The Seahawks won in overtime, producing this dizzying real-time win probabilities chart:
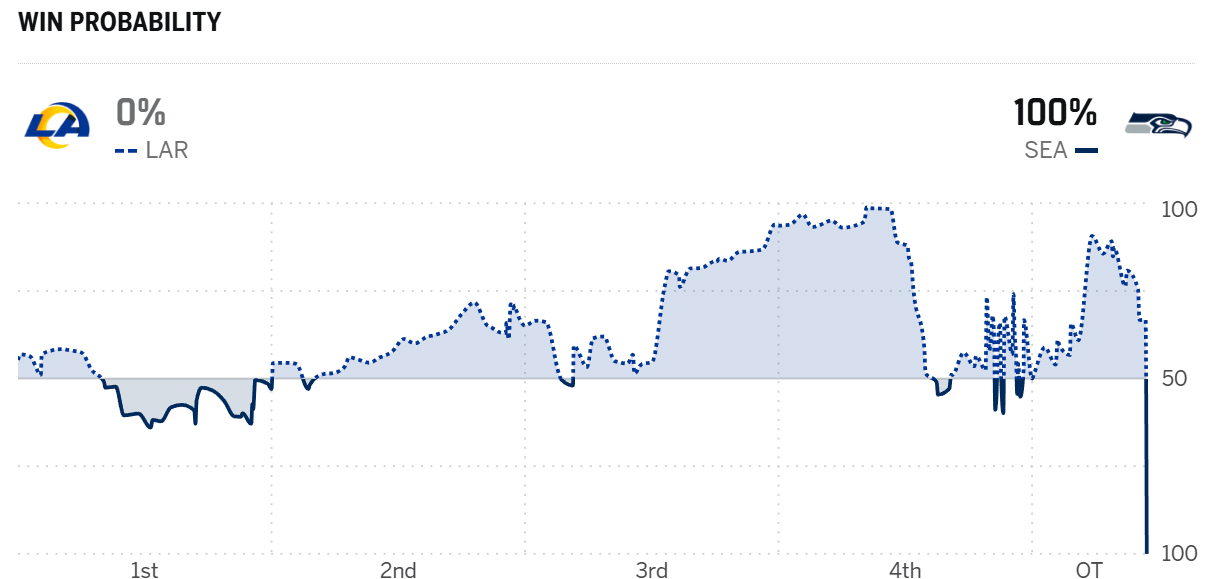
Sam Darnold indisputably engineered a highly improbable comeback. But with 10 minutes left in regulation, were the Seahawks’ odds of victory really just 1.2%? And every other time we’ve seen these win probability charts go wild: are the probabilities miscalibrated, or do we only remember the games that go against the odds? (Even a 1.2% chance should hit once every 83 times, after all.)
My guess was that these win probabilities were good in aggregate, but perhaps overly sensitive to swings in the action. But I didn’t know, so I decided to find out.
I started by pulling win probabilities for each game of the 2025 season as of the end of the 1st, 2nd, and 3rd quarters, and comparing them to the actual results.1 Because some odds were extremely rare (not many teams have an 80% win probability at the end of the first quarter), smoothing created too many data anomalies, so I settled for “bins” of 10 percentage points.
I asked the question: how often does a team with, say, 30-40% odds as of the end of the first (or second or third) quarter go on to win the game? If the probabilities are reliable, the result should be in the middle of the range.
Turns out, they are:
Interestingly, probabilities were noisiest at the end of the third quarter. Perhaps the models get more conservative toward the end, understating the odds of victory for the team with the lead and creating the dip visible between 40 and 70% win probability. But overall, these results suggest that in-game odds of victory are quite accurate.
Hold on, though: selecting the end of each quarter might have a smoothing effect that washes out an oversensitivity to big plays and lead changes. How often have we seen a 4th quarter score send win probabilities soaring, only to see the lead change yet again?
How often? I honestly had no idea. It seems like it happens with some regularity, but am I only remembering the outliers? I decided to test this as well.
This time, I pulled win probabilities after every single play all season long to identify any time in a game that a team’s win probability exceeded a certain threshold. If a team’s win probability ever eclipses, say, 70%, then they should only lose 30% of the time. But does that hold, or do we see teams’ probabilities spiking (or plummeting) and then recalibrating?
It holds remarkably well:
If anything, win probabilities again prove slightly conservative. If at any point in the game, a team’s win probabilities hit 70%, that team wins 72% of the time. At 80%, their actual probability is 82%, and at a 90% projection, they win 93% of the time.
I suppose I shouldn’t be surprised that win probabilities are well-calibrated—which does not, of course, make them terribly useful. The outcome of most games remains reasonably uncertain well into the action, which is why win probabilities so often hover between 40 and 60% until late in the game.
Statistically, moreover, with a 272-game regular season, we should expect to see about 14 teams blow 95% victory odds each season, with 11 such collapses anticipated by this point in the year. To date, nine teams have posted such spectacular losses, with one other game just missing the mark. I’m using nflverse data, which gave the aforementioned Rams 99.2% odds of victory at peak, compared to ESPN’s 98.8%.
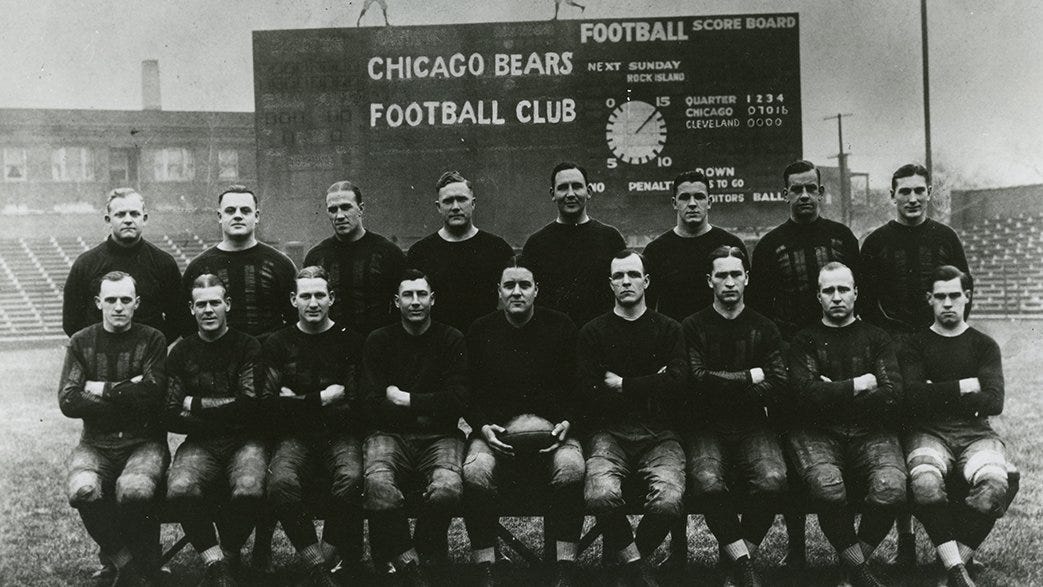
The Chicago Bears Threaten to Leave Over Taxes and Subsidies
I promised I’d get to taxes eventually. Here goes.
Last week, Chicago Bears team president Kevin Warren floated the possibility of moving the Bears to Northwest Indiana amid ongoing negotiations around a new home and a new stadium for the team.
The Bears have two asks. They want $855 million in public funding for new infrastructure (roads, utilities, commuter line adjustments) to support a stadium in the suburbs, along with legislation exempting construction materials from the sales tax for, and freezing property tax assessments on, megaprojects like their proposed stadium. The assessment freeze would be based on the land value assessed before major construction begins.
I discuss this at greater length in a blog post for the Tax Foundation, so I’ll cut to the chase. Illinois lawmakers are right to balk at the team’s demands for special treatment, but the Bears front office has a point, too: Illinois, and specifically Cook County, taxes are very high. I estimate that unabated property tax burdens for a new stadium complex at the team’s proposed new home in Arlington Heights, Illinois would run about $210 million per year, compared to $50-75 million per year if the team relocated to northwest Indiana.
In other words, operating in Illinois is expensive, whether you’re the Bears or any other business. Chicago and the state of Illinois have long sought to patch over an uncompetitive tax code with targeted incentives, but when those aren’t available, staying put is costly—even for a team as embedded in the community as Da Bears.
Obligatory Marketing Note
My new consultancy provides tax policy research, writing, and other services. If you are in the market for tax policy research or know someone who is, please let me know.
Please Share this Substack
This edition of The SALT Road isn’t representative of its typical content, but if you find this Substack valuable, please do me a favor and share it with colleagues and others who may be interested. And if you haven’t yet subscribed (it’s free), please consider doing so!
Scraping ESPN or NextGen Stats data would have been tedious and legally dubious, so I relied on the open-source nflverse datasets, which are extremely similar, but not entirely identical, to the projections you see on TV.
Great topic! And as always, well written!
It doesn’t shock me at all that the percentages are accurate, especially given that in the world of sports betting no one will believe you if you are constantly wrong.
With that said, you noted that the projections may be conservative. If that’s the case, do you think that a better could use that information to gain a statistical advantage over the long term? After all, a 2% advantage in the aggregate is big.